Demystifying Support and Resistance in Forex Trading
- Jonny Smith
- June 30, 2023
- Forex Trading For Beginners
- Best_forex_broker, ecn, ECN_Forex, forex, forex_brokers, Froex_Demo_Accounts, strategies, Support and Resistance
- 0 Comments
The Forex market is like a dance floor, with currency pairs swaying to the rhythm of economic indicators and events.
Two key concepts that guide this dance are ‘support’ and ‘resistance’. These levels are the tune to which prices waltz, helping traders predict potential price reversals and profitable trading opportunities. 🎶💃
Breaking Down Support and Resistance 🧱
In the simplest terms, support and resistance are specific price levels or zones that currency pairs struggle to break through.
Support 🧲
Think of support as the floor beneath the price, acting like a safety net preventing it from dropping further. It’s the level where buying pressure outweighs selling pressure, indicating that buyers may step in to push the price up.
Resistance 🎈
Resistance, on the other hand, is like a ceiling above the price, preventing it from rising higher. It’s the level where selling pressure outweighs buying pressure, suggesting that sellers may dominate and push the price down.
Let’s take these concepts out for a spin on the dance floor! 🕺
Identifying Support and Resistance Levels 🔍
Identifying these levels might seem like finding a needle in a haystack. But don’t worry! With practice and a keen eye, you can spot these crucial zones. Here’s how:
1. Swing Highs and Lows
Swing highs (peaks) and lows (troughs) often act as resistance and support levels, respectively. By connecting these points using horizontal lines on your chart, you can map out potential support and resistance levels.
2. Round Numbers
Prices often gravitate towards round numbers (like 1.2000, 1.3000, etc.), mainly because of the psychological impact these numbers have on traders. Hence, these levels can act as support or resistance.
3. Fibonacci Retracement Levels
Fibonacci retracement levels, derived from the famous Fibonacci sequence, can also serve as potential support and resistance levels. Traders use these percentages (23.6%, 38.2%, 50%, 61.8%, and 78.6%) to predict where a correction might end.

Using Support and Resistance in Trading 🖥️
Now that you know what support and resistance are and how to identify them, let’s dive into how you can use these levels in your trading strategy.
- Identify Potential Entry and Exit Points: Support and resistance levels can help you identify potential entry and exit points for your trades. For instance, if the price is approaching a resistance level, you might consider selling, expecting the price to bounce back down. Conversely, if the price is nearing a support level, you might consider buying, expecting the price to bounce back up.
- Set Stop Losses and Take Profit Levels: These levels can also guide you in setting your stop losses and take profit levels. A common strategy is to set a stop loss just below a support level for a long position or just above a resistance level for a short position.
Support and resistance are like the bread and butter of forex trading.
They provide valuable insights into the market’s psychology, helping traders understand where the price might potentially reverse. Stick around as we dive deeper into trading strategies involving support and resistance, chart patterns, and much more. Just say “continue” to keep the knowledge ball rolling! 🌐💼
Trading Strategies Involving Support and Resistance 📚📈
Support and resistance levels aren’t just road signs on your trading journey – they can be the foundation of your trading strategy! Let’s delve into some popular strategies involving these levels.
1. The Bounce 🏀
This strategy involves buying at support and selling at resistance. As the price approaches a support level, you expect it to bounce back and hence, consider a long position. Conversely, as it nears a resistance level, you expect it to bounce down and contemplate a short position. Remember, this strategy works best in range-bound markets.
2. The Breakout 🚀
Breakouts occur when the price breaks through a support or resistance level and keeps moving in the same direction. The key here is to wait for confirmation of the breakout, which could be a candlestick closing beyond the level or increased volume. Once confirmed, you could enter a trade in the direction of the breakout.
3. The Retest 🔄
Sometimes, after a breakout, the price returns to the broken support or resistance level before continuing in the direction of the breakout. This is known as a ‘retest’. You could consider entering a trade on the retest as it offers an extra layer of confirmation.

Understanding Chart Patterns 📉📈
While support and resistance levels give you an idea of where the price might reverse, chart patterns can hint at the potential direction of the reversal. These are recurring price patterns that traders often use to enter or exit trades. Let’s explore a few related to support and resistance:
1. Double Tops and Bottoms
A double top is a bearish reversal pattern that forms after an uptrend with two peaks at approximately the same level (resistance). A double bottom, on the other hand, is a bullish reversal pattern that forms after a downtrend with two troughs at roughly the same level (support).
2. Head and Shoulders
A head and shoulders pattern is another bearish reversal pattern. It consists of a peak (head), followed and preceded by two smaller peaks (shoulders), resembling a human head and shoulders. The support level in this pattern is known as the ‘neckline’.
3. Triangles
Triangles can be ascending, descending, or symmetrical and generally indicate a continuation of the current trend. They contain at least two support and resistance levels that the price bounces between until a breakout occurs.
The Role of Indicators in Determining Support and Resistance Levels 📊🔍
While manually identifying support and resistance levels can be effective, forex indicators can add another layer of precision to this process. Several popular technical indicators specifically help to pinpoint these pivotal levels more accurately:
1. Moving Averages
A moving average (MA) smoothens price data to create a flowing line on the chart. The line acts as a dynamic support or resistance level. When the price is above the MA, it serves as a support, and when it’s below, it acts as a resistance.
2. Bollinger Bands
Bollinger Bands consist of a middle band (which is a moving average) and an upper and lower band. The upper and lower bands can act as dynamic resistance and support levels, respectively.
3. Pivot Points
Pivot Points are frequently used by day traders to quickly determine where forex market sentiment may change between bullish and bearish. They are levels of support and resistance which are calculated using the previous session’s high, low, and closing prices.
Important Reminders about Support and Resistance Levels ⚠️📝
Understanding and identifying support and resistance levels is crucial in forex trading, but it’s also important to remember that these concepts aren’t an exact science. Here are a few reminders to consider:
- Support and resistance levels are zones: While it’s often helpful to look for exact price levels, remember that these levels are usually zones rather than exact numbers.
- The more often a level is tested, the stronger it becomes: If a support or resistance level holds multiple times, it becomes more credible. However, remember that a level may also weaken after multiple tests as it can get depleted of buy/sell orders.
- What was support can become resistance, and vice versa: When price breaks through a support level, it can become a resistance level, and when it breaks a resistance level, it can become a support level.
Support and Resistance: The Psychological Perspective 🧠💰
Alright, we’ve discussed a lot about the technical side of support and resistance. Now, let’s switch gears and talk about the psychological aspects of these levels. After all, the Forex market is heavily driven by the psychology of market participants.
1. Why do Prices Bounce? The Psychology of Buying and Selling 🧲
You might wonder, why do prices tend to reverse at these so-called support and resistance levels?
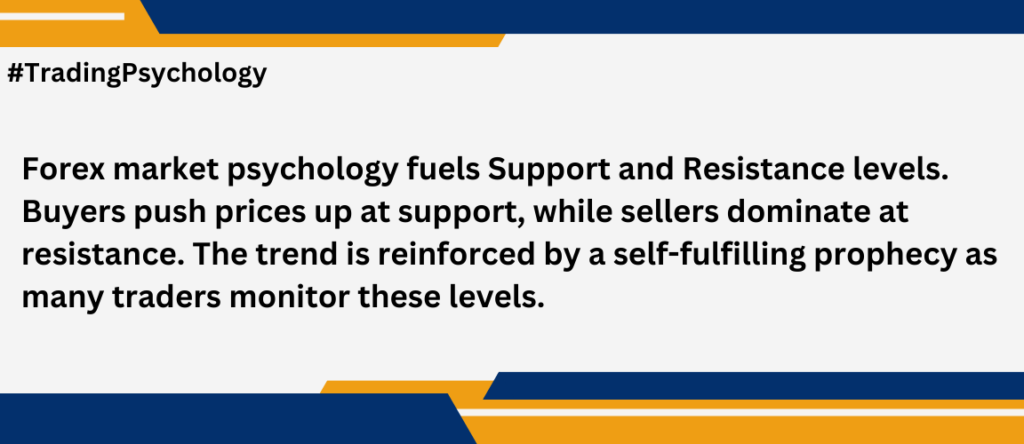
Well, it’s all about supply (selling pressure) and demand (buying pressure). At support levels, there’s an increased demand or interest from buyers. They see the level as an attractive point to enter a trade, believing that the price will increase from that point.
On the other hand, at resistance levels, sellers start to dominate. They believe the price is high and could go down, so they prefer to sell at these levels.
The tug of war between buyers and sellers at these levels results in the price “bouncing” off these levels.
2. The Self-Fulfilling Prophecy of Support and Resistance Levels 🔄
The effectiveness of support and resistance levels often boils down to a self-fulfilling prophecy. Since many traders watch these levels and place buy and sell orders around them, these levels can impact the price behavior.
This doesn’t mean that these levels always hold. But their widespread recognition in the trading community increases their significance.
3. The Bigger Picture: Trend Lines and Channels 🌐
Support and resistance levels become even more powerful when combined with trend lines and channels.
Trend lines are diagonal lines that connect at least two price lows or highs, indicating the direction of the market (upwards, downwards, or sideways).
When parallel trend lines can be drawn for both the highs and lows, a price channel is created. The upper trend line acts as resistance, and the lower trend line acts as support.
Summing it Up 🎯
Support and resistance aren’t merely abstract concepts. They represent key psychological thresholds where major buying or selling activities occur. Understanding the psychology behind these levels and combining them with other technical analysis tools can significantly enhance your trading strategy.
Remember, the ultimate goal isn’t to win every single trade—it’s to make informed decisions, manage your risk effectively, and come out profitable in the long run.
And that wraps up our deep dive into support and resistance in Forex trading! Ready to dance with the price movements? Just say “continue” for more enriching insights into the world of Forex trading! 🎶💰🌐